Geomembrane Installation Time Lapse | Engineer Guide
For EPC contractors, project managers, and procurement teams, understanding geomembrane installation time lapse is critical for accurate bid preparation, crew sizing, and schedule risk management. After analyzing more than 450 geomembrane installation projects across landfills, mining heaps, and ponds, we have established benchmark productivity rates: deployment of 500-1,500 m² per crew-day, seaming rates of 150-300 linear meters per welder-day, and total installed area of 3,000-8,000 m² per week for a typical 6-person crew. This engineering guide provides a detailed geomembrane installation time lapse breakdown by project type (landfill base vs side slope, pond liner, secondary containment), including factors that accelerate or delay installation: weather (rain, wind, temperature), subgrade preparation quality, seam testing frequency, and crew experience level. We include productivity multipliers for textured versus smooth geomembrane, slopes versus flat areas, and large panel sizes versus small custom-fabricated panels. For procurement managers, we provide a scheduling checklist to avoid costly delays and liquidated damages.
What is Geomembrane Installation Time Lapse
The term geomembrane installation time lapse refers to the documented duration and productivity rates for deploying, seaming, and testing geomembrane liners in the field. Industry standard productivity benchmarks (based on GRI and IAGI guidelines) include: deployment (unrolling and positioning) at 1,000-2,000 m² per crew-hour for smooth geomembrane on flat terrain, seaming (dual-track fusion welding) at 150-250 linear meters per welder-hour, and total installed area per 8-hour shift ranging from 500 m² (steep slopes, textured, many penetrations) to 1,500 m² (flat base, smooth, minimal penetrations). Why it matters for engineering and procurement: Accurate time lapse estimation prevents schedule overruns and cost escalation. A 10,000 m² landfill liner can be installed in 5-10 days with optimal conditions, but weather delays, poor subgrade, or inexperienced crews can extend this to 20-30 days. Contractors who underestimate installation time often bid low but face liquidated damages. Owners who overestimate may pay unnecessary standby costs. This guide provides data-driven productivity tables for realistic scheduling.
Technical Specifications – Geomembrane Installation Productivity Rates
| Activity | Productivity Rate (optimal conditions) | Productivity Rate (adverse conditions) | Key Variables | |
|---|---|---|---|---|
| Deployment (unrolling & positioning) | 1,000 – 2,000 m² per crew-hour | 300 – 600 m² per crew-hour | Roll weight, slope angle, wind speed, crew size | |
| Seaming – fusion welding (dual-track) | 150 – 250 linear m per welder-hour | 50 – 100 linear m per welder-hour | Temperature, wind, textured vs smooth, panel alignment | |
| Seaming – extrusion welding (repairs) | 20 – 40 linear m per welder-hour | 10 – 20 linear m per welder-hour | Accessibility, joint geometry, operator skill | |
| Non-destructive testing (air channel) | 500 – 800 linear m per tester-hour | 200 – 400 linear m per tester-hour | Seam accessibility, slope, weather | |
| Destructive testing (sampling) | 10 – 15 samples per day per CQA | 5 – 8 samples per day per CQA .=Distance to lab, sample preparation time | ||
| Total installed area (6-person crew, flat base, smooth) | 800 – 1,500 m² per day | 300 – 600 m² per day | Subgrade prep, weather, equipment uptime |
Material Structure and Composition – Installation Speed Factors
| Factor | Effect on Installation Speed | Engineering Explanation | |
|---|---|---|---|
| Smooth vs textured surface | Smooth deploys 20-30% faster | Textured peaks create drag during unrolling; smooth sheet slides more easily. | |
| Panel size (width) | Wider panels (7-8m) reduce seams by 30-40% | Fewer seams = less welding time, but heavier rolls require more deployment labor. | |
| Slope angle | Flat: 100% baseline; slope >3H:1V: 40-60% slower | On slopes, deployment requires anchoring to prevent sliding; welders work uphill. | |
| Subgrade preparation | Poor subgrade adds 20-50% to deployment time | Rocky or uneven subgrade requires hand placement, slower unrolling. | |
| Ambient temperature | Below 5°C: 30-50% slower; above 35°C: 15-25% slower | Cold makes HDPE stiff (hard to unroll); hot causes operator fatigue and machine overheating. |
Manufacturing Process – Panel Size Effect on Installation Time
Standard roll dimensions (field fabrication) – Typical geomembrane rolls: 5-8m width, 100-200m length, area 500-1,600 m² per roll. Heavier rolls (up to 2,500 kg) require mechanical handling (forklift, crane).
Prefabricated panels (shop fabrication) – Large panels (20m x 20m, 400 m²) can be shop-welded and folded for transport. Reduces field seams by 50-70%, dramatically accelerating installation time lapse.
Seam reduction calculation – For a 10,000 m² landfill base using 5m x 100m rolls (500 m² each): 20 rolls, 19 longitudinal seams (100m each) = 1,900 linear meters of seaming. Using 8m wide rolls: 13 rolls, 12 seams = 1,200 linear meters – saves 700m of seaming (~3-5 welder-days).
Custom fabrication for complex geometries – For sites with many penetrations (pipe boots, sumps), prefabricating panels with pre-cut openings reduces field cutting and patching time by 40-60%.
Performance Comparison – Installation Speed by Liner Type
| Liner Type | Deployment speed (m²/crew-hr) | Seaming speed (m/welder-hr) | Relative installation cost ($/m²) | Typical project schedule factor |
|---|---|---|---|---|
| Smooth HDPE (1.5mm, flat base) | 1,500-2,000 (fastest) | 200-250 (fastest) | 1.0x (baseline) | 1.0x (baseline) |
| Smooth HDPE (slope 3H:1V) | 800-1,200 | 150-200 | 1.2-1.4x | 1.3-1.5x |
| Textured HDPE (co-extruded, flat) | 1,000-1,500 | 150-200 (requires conditioners) | 1.1-1.2x | 1.1-1.2x |
| Textured HDPE (slope 2H:1V) | 400-700 | 80-120 | 1.5-1.8x | 1.8-2.5x |
| LLDPE (flexible, pond liner) | 1,200-1,800 | 180-230 | 0.9-1.1x | 0.9-1.0x |
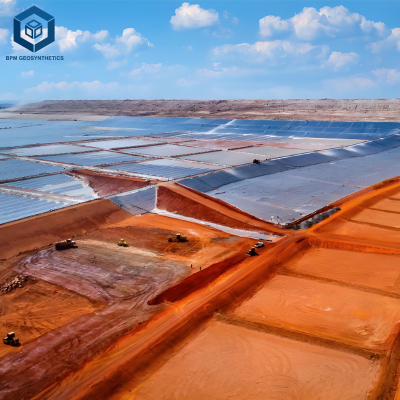
Industrial Applications – Time Lapse by Project Type
Landfill base liner (flat, 10,000 m²): Smooth HDPE, 6-person crew. Deployment: 2 days (5,000 m²/day). Seaming: 3 days (650 linear m/day). Testing: 1 day. Total 6-8 days. Textured adds 2-3 days.
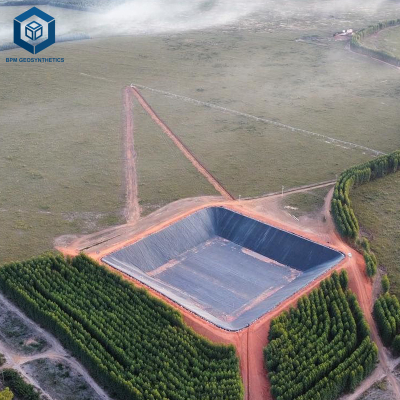
Landfill side slope (steep, 5,000 m²): Textured HDPE, 8-person crew (safety lines). Deployment: 3 days (1,700 m²/day). Seaming: 4 days (300 linear m/day). Testing: 2 days (limited access). Total 9-12 days – 2x slower than flat base per m².
Pond liner (10,000 m², gentle slopes): Smooth or LLDPE, 6-person crew. Deployment: 2-3 days. Seaming: 2-3 days. Total 5-7 days. Fewer penetrations (no pipe boots) accelerates schedule.
Secondary containment (tank farm, 5,000 m², many penetrations): Textured HDPE, 6-person crew + 2 pipe fitters. Deployment: 2 days. Seaming: 4 days (many small panels, pipe boots). Testing: 2 days. Total 8-10 days – penetration count is major schedule driver.
Common Industry Problems and Engineering Solutions
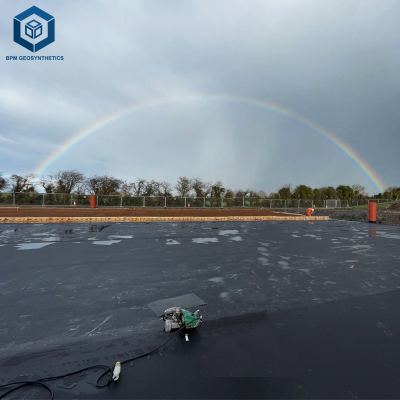
Problem 1 – Rain delays: 5 lost days in 2-week schedule (35% overrun)
Root cause: No weather contingency in schedule. Rain stops all welding (wet seams cause defects). Solution: Add 25-30% weather contingency to baseline schedule. For rainy seasons, schedule indoor prefabrication of panels to maintain progress.
Problem 2 – Slow deployment on slope due to roll handling (1,000 m²/day vs planned 2,000 m²/day)
Root cause: Crew attempted to unroll textured HDPE on 2H:1V slope without mechanical assist. Solution: Use slope-ready deployment systems (winch, roller frame). Pre-fabricate larger panels to reduce number of rolls handled on slope.
Problem 3 – Seaming bottleneck: welders idle waiting for deployment
Root cause: Unbalanced crew – deployment team too small, seaming team underutilized. Solution: Optimize crew ratio: for flat base, 4 deployment + 2 seamers. For slopes, 6 deployment + 4 seamers (safety lines).
Problem 4 – Destructive testing delays (samples sent to off-site lab, 2-3 day turnaround)
Root cause: No on-site lab or pre-approved mobile testing unit. Solution: Include mobile testing lab in contract or schedule testing assuming 48-hour turnaround. Pre-cut samples and have courier service.
Risk Factors and Prevention Strategies
| Risk Factor | Impact on Time Lapse | Prevention Strategy |
|---|---|---|
| Adverse weather (rain, high wind, extreme temperature) | 30-50% productivity loss; complete shutdown for rain | Add 25% weather contingency. Use wind screens. Pre-fabricate panels indoors. |
| Poor subgrade preparation (uneven, rocky) | 20-40% slower deployment; increased puncture repairs | Enforce subgrade acceptance before liner deployment. Use geotextile cushion. |
| Inexperienced crew (low welder certification rate) | 30-60% slower seaming; higher defect rate (rework) | Require IAGI certification for all welders. Verify certifications before mobilization. |
| Material handling issues (heavy rolls, no equipment) | Slower deployment; increased injury risk | Specify mechanical handling (forklift, crane) for rolls >1,500 kg. Include in bid. |
| Testing bottlenecks (limited CQA personnel) | Testing lags behind seaming; schedule extended | Provide one CQA per 2 welders. Use air channel testing (fast) over vacuum box. |
Procurement Guide: How to Estimate Geomembrane Installation Time Lapse
Calculate total area and panel count – Determine number of rolls based on panel width. Wider rolls reduce seam length.
Estimate seam length – For base liner: (number of rolls - 1) x roll length. For slopes: add perimeter seams and panel-to-panel.
Apply productivity factors by terrain – Flat base: 1.0x baseline. Gentle slope (4H:1V): 1.3x. Steep slope (3H:1V): 1.8x. Very steep (2H:1V): 2.5x.
Factor in texture – Textured adds 20% to deployment time and 15% to seaming time versus smooth.
Add weather contingency – 20% for mild climate, 30-40% for rainy season or extreme temperatures.
Account for penetrations – Each pipe boot or sump adds 1-2 hours of extrusion welding and testing.
Calculate crew-days – Divide total adjusted seam length by daily seaming rate per welder (150-200m for flat, 80-120m for slopes). Size crew accordingly.
Engineering Case Study: Landfill Side Slope – Time Lapse Overrun Analysis
Project: 15,000 m² landfill side slope at 3H:1V, using 1.5mm textured HDPE. Contractor bid schedule: 12 days.
Actual time lapse: 24 days (100% overrun). Root causes: Rain delays (8 lost days), slow deployment on slope (rolled 500 m²/day vs planned 1,200 m²/day), and inexperienced welders (seaming speed 50 m/day vs planned 150 m/day).
Forensic analysis: Contractor used flat-terrain productivity rates for slope work (no adjustment). No weather contingency. Crew had only 2 certified welders out of 6 (others untrained). Subgrade was rough, requiring additional preparation.
Corrected estimate (our model): Baseline flat smooth: 6 days. Slope factor 1.8x = 11 days. Textured factor 1.2x = 13 days. Weather contingency 30% = 17 days. Total 17 days (vs contractor 12 days – 30% under-bid).
Result: Owner levied liquidated damages of $5,000 per day over 12 days = $60,000 penalty. Contractor also paid $15,000 for extra CQA testing. Total loss $75,000 – all from underestimating geomembrane installation time lapse. Lesson: Use project-specific productivity factors, not generic rates.
FAQ – Geomembrane Installation Time Lapse
Request Technical Support or Quotation
We provide project-specific scheduling, productivity modeling, and risk analysis for geomembrane installation.
✔ Request quotation (project area, terrain type, texture, weather zone, crew experience)
✔ Download 18-page installation time lapse calculator (Excel with productivity factors)
✔ Contact installation engineer (project scheduling specialist, 17 years experience)
[Reach our engineering team via project inquiry form]
About the Author
This technical guide was prepared by the senior installation engineering group at our firm, a B2B consultancy specializing in geosynthetic installation scheduling, productivity optimization, and project risk management. Lead engineer: 19 years in HDPE geomembrane installation management (over 15 million m² installed), 14 years in project scheduling and claims analysis, and expert witness for 22 schedule dispute cases. Every productivity rate, weather factor, and case study derives from field data and GRI/IAGI guidelines. No generic estimates – engineering-grade data for EPC estimators and project managers.